Normative Data
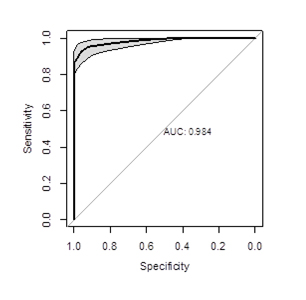
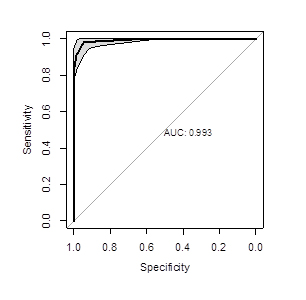
Validation Data : P-Cog Exam
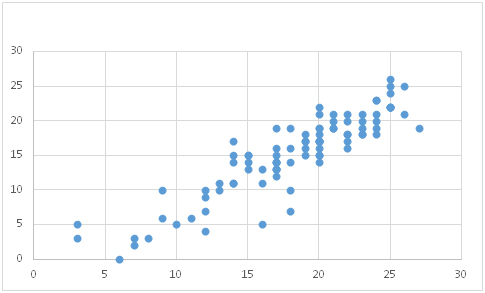
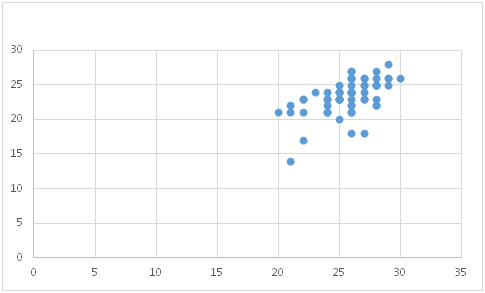
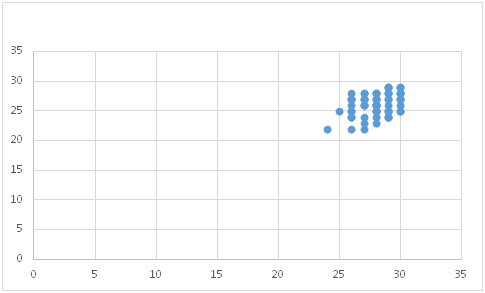
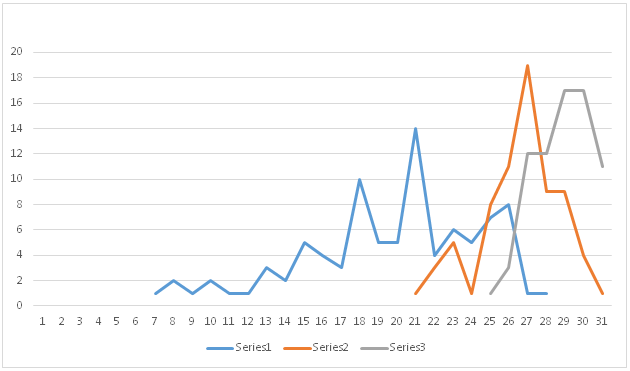
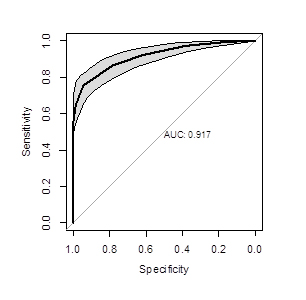
Figure 1
P-Cog (Philadelphia cognitive)
Raw scores for AD (series 1), MCI (series 2), and normal (series 3). Cut points appear to be >25, MCI and normal.
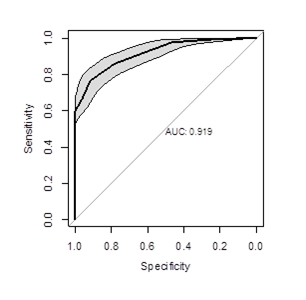
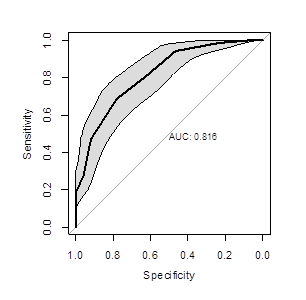
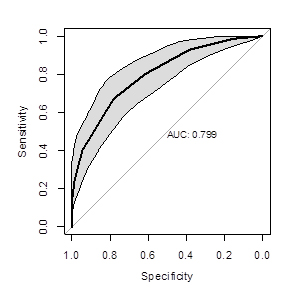
Figure 2
MoCA (Montreal Cognitive Assessment testing)
Raw scores for AD (series 1), MCI (series 2), and normal (series 3).
Descriptive statistics
There were no significant differences in age (p-value: 0.4223), or sex distribution (p-value: 0.09413) between the three diagnostic categories in the sample (Table 1). Educational attainment was nominally significant (p-value: 0.015), approximately 15% fewer of the cognitively impaired subjects reported continuing education past high school compared with the two other categories.
Table 1: Age, education, and sex by diagnostic category
| Diagnosis | n | Age (sd) | Completed education >12 (%) | FEMALE n (%) |
|---|---|---|---|---|
| Cognitive impairment | 109 | 75.3 (± 9.68) | 62.4% | 42% |
| Mild cognitive impairment | 70 | 72.3 (±10.15) | 77.2% | 48.5% |
| No cognitive impairment | 73 | 74.46(± 9.14) | 78% | 54.7% |